

Hate crime, hate groups and scale
An analysis of hate crime and hate groups in the US, must consider spatial properties and how they relate to the research question at hand. Hate crime and hate groups both display patterns of spatial unevenness at multiple scales and with differing patterns of clustering and dispersal.
Scale, site and situation are distinctive properties of spatial data. Scale can refer to hierarchical levels of aggregation of spatial data,, nested together with appropriate levels of detail used as units of analysis. Site refers to the specific characteristics of a place and its history, while situation refers to how a specific place or location is connected to other places. Spatial analysis drills through diverse datasets, and might reveal evidence of a pattern or not in alignments of overlays, and intersections between discrete sets of data, collected as features and as attributes.
Spatial data are usually not random, often violating the assumptions for non-spatial statistical analysis (Sullivan and Unwin, 2003:28). In a spatial analysis the emphasis is on describing and explaining spatial unevenness across the study area, describing the “spatial auto-correlation structure” for an attribute (Sullivan and Unwin, 2003:29). Auto-spatial correlation means simply that things closer together are more alike than things farther away. Expensive houses are more likely to be close to other expensive houses, and clay soils are more likely to be close to clay soils. Explanation is temporal, but spatial relationships point to correlation, to simultaneity; what is closer to, what is found with, what is inside or outside of an area and how these relationships might be holistically interpreted as well as explained. Maps represent simultaneity.
Hate crimes seem to have a regional pattern (Gale 2002) when aggregated at the level of states. That pattern is not strongly related to sociological or economic variables. Jefferson and Pryor (1999) find that economic or sociological explanations are less important than history and the particular circumstances of localities where hate groups are found.
For example, a scatter plot of hate crime rates by percent of whites in states, shows very little correlation between whiteness(a sociological variable) and hate crimes, despite the fact that whites are more heavily settled across the north rather than the south ( R2 = .0072) for the lower forty eight states and the District of Columbia.

One possible factor that might be associated with hate crimes is the activities of hate groups with fascist overtones, which might be evident in similarities between state by state distributions of hate crimes and hate groups when normalized by population. At the state level cartographic visualizations suggest that this is not the case.
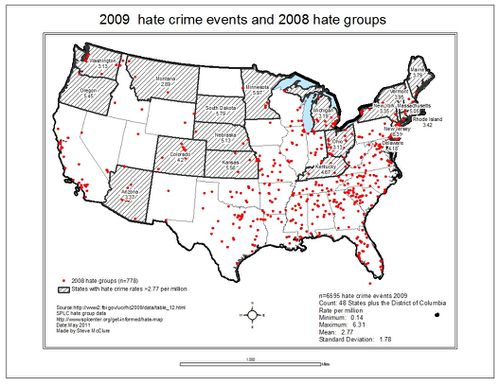
The pattern of hate groups diverges from the pattern of hate crimes at the state level of aggregation. Ryan and Leeson (2010) find that hate groups have no influence on hate crime in the United States at the state level of aggregation. Most hate groups of all types seem to be located in a band that stretches north to south while the rates of hate groups per million seem to be higher than the mean in the Northwest quadrant and in the Southeast. Of all the bounded units included, 48 states and Washington DC, only one place has an overlap between high hate crimes and high hate groups—Washington DC. Washington is unique since it is a bounded city, unlike all the other areas. It is more similar to counties or municipal areas where a correlation between hate groups and hate crimes might be found.

At the county level of aggregation, Mulholland (2011: 15) finds “Counties with active white supremacist chapters experience greater rates of hate crime”.
At an event more granular level, in a study of hate crime in LA, Umemoto and Mikami (1999:17) found that hate crime hot spot clusters that, “a large number of identified clusters involve organized groups including white supremacist groups and street gangs”.
If one is interested in describing and explaining spatial unevenness, simultaneity rather than causality then the hate crime and hate group patterns at the state level are suggestive of divergent spatial processes at work. Hate groups are localized (Jefferson and Pryor 1999; Umemoto and Mikami 1999), with regionally specific patterns of concentration and dispersal. Gale (2002) finds that relative income as a proxy for envy has a significant effect on the hate crime rate using the FBI hate crime data at the state level of aggregation. This might act as a triggering condition for hate crimes at the local scale, particularly when hate groups are organized and active in a particular locality.
Hate crime and hate group patterns are socially produced; examples of a socio-spatial dialectic, embedded in specific space-time envelopes dynamically changing. Statistics and other empirical data collected about hate crimes and hate groups is collected from within a specific set of assumptions about appropriate scale of analysis, these assumptions also shape findings which might be contradictory at different scales. The research about hate crimes and hate groups demonstrate some of these contradictions. Aggregation units matter.
Another way to research hate crimes would be to collect and analyse data collaboratively using web 2.0 tools and integrating qualitative and quantitative methods to create multi-media representions. Point data could be collected using volunteered geographic information, with geotagged photos, video clips and text.
References cited:
Gale, Lewis R.,Will C. Heath, and RandW. Ressler. 2002. "An Economic
Analysis of Hate Crime." Eastern Economic Journal 28: 203-15.
Jefferson, Philip N, and Frederic L. Pryor, 1999. "On the Geography of
Hate," Economics Letters, 65(3), 389-395.
Ryan, Matt E. and Leeson, Peter T., Hate Groups and Hate Crime (November 12, 2010). Available at SSRN: http://ssrn.com/abstract=1708181
Umemoto K, and Mikami,K. A Profile of Race-bias Hate Crimes in Los Angeles County. June 1999. http://www.lewis.ucla.edu/publications/workingpapers.cfm