

The messenger
I was asked to help estimate the demographics of the listener supported radio station WPFW located in NW Washington DC. The station provided an excel table of recent data on donors by zip codes. The station also provided the service area boundaries and sent it as a jpeg. I promptly geo-rectified it and used the image to extract service area data as a vector feature.
Using the tract level census data from the 2000 census, I estimate the total population in the entire service area for age groups, pan-ethnic categories and gender. I also calculated the same counts for each ring of the service pattern.
There is a long history and much research on concentric ring theory in geography from the
Von Thunen model to the Chicago school, urban land use
has been conceptualized in terms of rings or later by Walter Christaller in terms of hierachies of central places...as
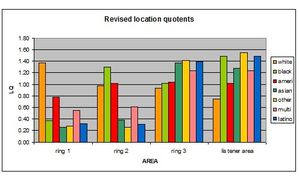
hexagons. For a radio station, concentric rings indicate signal srength and total potential listeners. I aggregated tract level census data to the rings calculated percentages of the total
service area population contained in each ring, then calculated the location quotents by pan-ethnic category for each service area ring. Concentric rings can only tell part of a story about urban areas, particularly when space is a social product of spatial
practices.
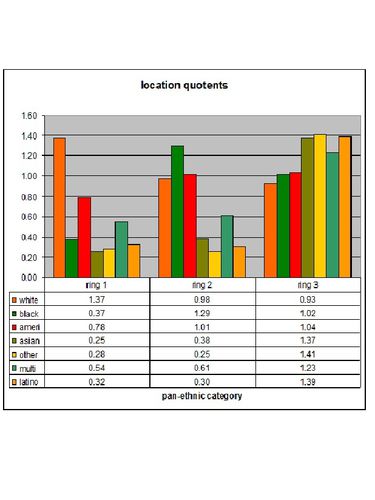 What was interesting to me was the likelihood of Euro-americans to be located in the first ring, that ring being the
furthest out, while African Americans had a higher likelihood of being located in the second ring, a ring that I might add includes the city of Baltimore. All the other pan-ethnic groupings to a
greater degree would most likely to be found in the center ring(ring 3).Most of the regional population is found in the third ring, 64%, while 23% are in ring 2, and the remaining 13% in the
outside ring, the total population from the 2000 census data was approximately 7-8 million.
What was interesting to me was the likelihood of Euro-americans to be located in the first ring, that ring being the
furthest out, while African Americans had a higher likelihood of being located in the second ring, a ring that I might add includes the city of Baltimore. All the other pan-ethnic groupings to a
greater degree would most likely to be found in the center ring(ring 3).Most of the regional population is found in the third ring, 64%, while 23% are in ring 2, and the remaining 13% in the
outside ring, the total population from the 2000 census data was approximately 7-8 million.
The population is not evenly distributed across those rings, Much of the regional population is
concentrated in the suburban counties of Fairfax and Montgomery. DC itself is hollowed out, its population having peaked in the late 1960s at about 800,000 and then declining as the suburbs grew
as the federal government decentralized, downsized, and privatized. 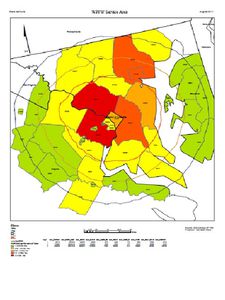 Using the counts of station members by zip codes and measuring their distance to the radio station allowed me to examine distance decay and donor counts by zip codes in a
scatter plot. Plotting donors over distance, trend lines could be fit to the data. Not suprisingly, a power law line was the best fit, with an R squared value of around .47; explaining almost
half the variation by distance from the radio station alone.
Using the counts of station members by zip codes and measuring their distance to the radio station allowed me to examine distance decay and donor counts by zip codes in a
scatter plot. Plotting donors over distance, trend lines could be fit to the data. Not suprisingly, a power law line was the best fit, with an R squared value of around .47; explaining almost
half the variation by distance from the radio station alone.
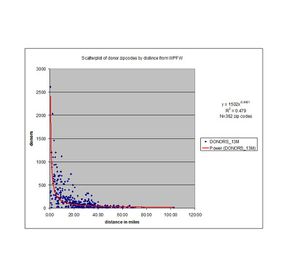 What is apparent in the scatter plot is that the mile ranges between 0 and fourty miles have the greatest divergence from the best fit line. This distance captures
both the DC suburbs and Baltimore. Since about half the variation cannot be explained, by distance, other variables must be considered.
What is apparent in the scatter plot is that the mile ranges between 0 and fourty miles have the greatest divergence from the best fit line. This distance captures
both the DC suburbs and Baltimore. Since about half the variation cannot be explained, by distance, other variables must be considered.
Using an interpolation technique, I extracted the precentage of African Americans and precentage of people over the age of 39 onto the zip codes , and made scatterplots to see if there might be a correlation between donors by zip code and ethnic composition of zip codes. The scatter plots showed some association between precentage of African Americans and donor counts(.16 R squared) , but for age there was almost no relationship.
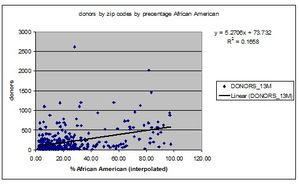
Based on these scatter plots, I ran a spatially weighted regression using "race" as a predictor for donors. The R squared value was .67, almost 70 precent of variation in donor counts for zip codes can be explained by ethnicity, taking into account distance from the station.
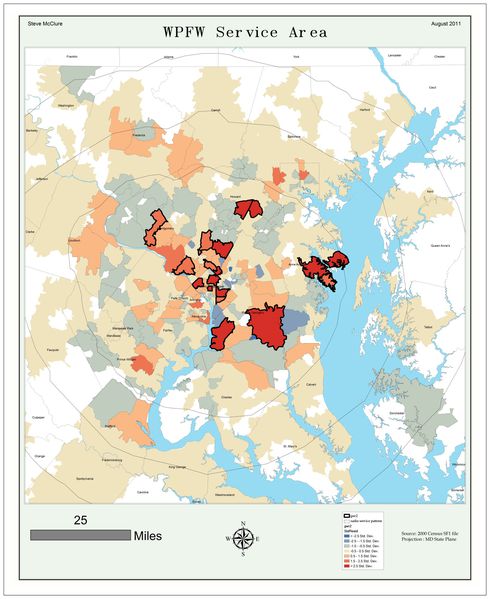 The mapping of residuals points to outlier zip codes where factors other than race or closeness to the station are factors in making contributions.But about 30 percent
of the variation in the counts of donors to the radio station are unexplained. The blue areas are zip codes with less than expected donor counts based on the weighted race variable. These are
areas which should be served by the station but are not.
The mapping of residuals points to outlier zip codes where factors other than race or closeness to the station are factors in making contributions.But about 30 percent
of the variation in the counts of donors to the radio station are unexplained. The blue areas are zip codes with less than expected donor counts based on the weighted race variable. These are
areas which should be served by the station but are not.
Decomposing the key zip codes, labeled gwr2 above, into thier consituent tracts, those zip codes
reflect a diverse mix, in fact, a scatter plot of donor zip codes showed almost no association between distance from the station and precentage of African Americans.
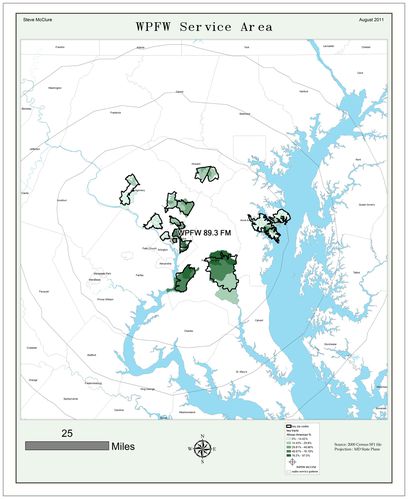
Still, the pattern of donors and likely listeners closely resembles the pattern of African American
settlement across the Capital Crescent, as another exploratory mapping shows, and when controlling for distance, there is a strong relationship between ethnicity and sponsorship by
zip codes. Clustering and proximity are other spatial factors that might be related to both listernership and sponsorship.
I used the position of the zip code center points and the count of members to estimate the density of listeners as a whole, based on the assuption that listeners are more like donors and that things closer together are more alike than things farther apart.
Using interpolation techniques both the counts of members and distances between zip code center
points to be used to generate a surface as representation of listeners.
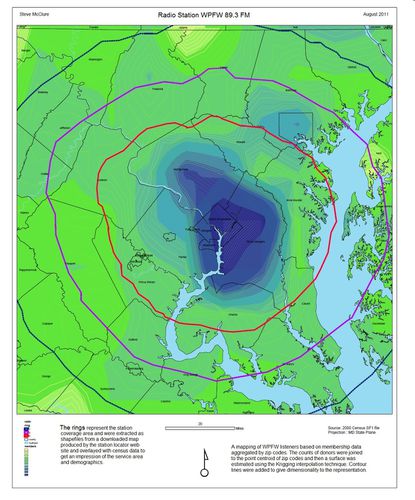
. If the percentage of listeners to donors is about 1% and if incomes and ability to contribute are linked, then listeners would be high in areas with low counts of donors. Transforming the surface representation into a discrete entity in vector allowed me to more carefully designate the likely listener area.
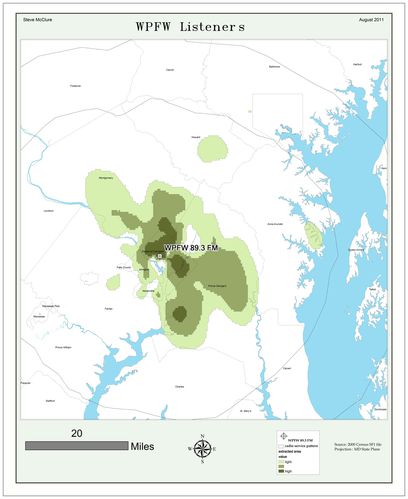
Based assumption that the donor pattern and listenership are related, it is likely that the areas actually served by the station match the pattern of African American settlement across the region. A revised graph of location quotents for the rings, including the hypothetical listener area illustrates this, even if high donor zip codes, and scatter plots are counter intuitive. The point is that the donor zip codes have a pattern strongly related to distance from the station and to each other, and an interpolation between those points might be a useful proxy measure of the spatial distribution of listeners, something related less to demography, and more to political, cultural, social ties, invisable in the the census numbers, but spatial practices none the less.
Looking at the market segmentation models developed by Claritas for specific zip codes with high numbers of contributors, market segments represented tended to reflect an urban bohemian mix of young hipsters, aging working class African Americans, and affluent empty nesters of all ethnicities.
Market segmentation models while limited and subjective in thier own special way provide one way to look at some of these qualitative factors that define communities and networks of relationships which define social life. A listener supported radio station is an imagined community bound together by a shared experience. Nieghborhoods are not arbritrary settlements but are products of spatial practices, they are places. Places are spatio temporal envelopes created by political, economic and social pracfices as the lived spaces of everyday life.
Places have histories, and are situated in relation to other places, and in the context of other entities at other scales, either as nested hierarchies, as in census tracts to zip codes, to counties to states, as discete entities. They can also be concetualized as continuous fields with indeterminate boundaries, elusive and ambiguous. Another metaphor which could be used to visualize places is a dynamic undirected network. Ultimately,the meaning of place is fixed through a social imaginary, or an iconic image. Washington is the monumental core, while DC is Ben`s Chili Bowl. Place is constantly being constructed through narrative, the Windy City, the Big Apple, or the City of Quartz.
Power defines place, as concieved, percived and lived spaces, political economy valorizes and devalorizes the spaces of places, a manifestation of the inherent contradictions of race class and gender. Space is not a static envelope where the actions of history are played out but one end of a contiumn linking space and time. Using zip codes, cencus tracts, state collected statistics mashing them into linear cartesian logics reveals some things about space, even the space of WPFW listeners and members, but it also conceals sualtern spaces, alternative meanings and histories.
The digital world is data rich, collaborative, and dynamic, a qualitative investigation into the
nieghborhoods where WPFW is supported could begin with images and texts, blogs and websites relating to those places.
As a jass station, as a progressive Washington DC institution, WPFW does serve its mission to a specific slice of the community. As a collective organizer for a region with a population of eight million,including two urban centers, DC and Baltimore,and urbanized suburban counties with populations greater than either urban core, the station could do better, even if it serves an important niche market and keeps jazz alive.
"Since its inception, volunteerism has been at the heart of WPFW. Our own Von Martin, a volunteer, was the first voice to sign the station on a quarter of a century ago. Von began his first broadcast with Duke Ellington's "Take the ‘A' Train" and we've been the "Jazz Messenger" ever since. ...They come to WPFW and they stay because of their love for the station, its listeners and the craft of broadcasting. Through volunteerism, WPFW provides neighbors, friends, and family members opportunities to learn broadcasting and to gain a better understanding of the global community in which we live"
The station, founded in the late 1970s, has been passed by in the transformation of the Washington Metropolitian area, from a modern city to post-modern poly-centeric cluster of urban nodes linked more tightly to the global flows of power and money and less to the regional or local tributary peripheries. The core set of WPFW supporters are drawn from an area close in to the city, while the high growth and multi-ethnic zones in Germantown and Fairfax, Frederick and Prince William Co, are under-reprsented. The area around College Park is a lagoon in the interpolated surface renderings, maybe students are finding other venues for news and music.
The geographically weighted regression suggests that the listeners and donors are drawn by the content, not only by proximity, but that there are lots of opportunities to expand listenership by building on its strengths and reaching out to new sectors in the entire service area, as underserved as the loyal down county and DC based listeners and members.
With its neoliberal transformation the city and the entire Capital Cresent region have become a new immigrant gateway more likely to have thier media needs met by commercial ethnic media oriented toward the emerging global youth culture flavored by hip hop, gogo, and salsa.
As a political voice, WPFW speaks forcefully to the concerns and needs of DC and PG county residents in a progressive way, but with a 1% membership rate in its highest supporting zip codes, maybe more work needs to be done to link the culture with the message, and link the emerging culture with the historical cultures of resistance and empowerment.
The high population entho-burbs of NoVA , MoCo and Frederick all of which are
within the primary service area, the inner ring, are not areas with many donors, or likely many listeners, but with the same needs and concerns as thier down county, or urban
couterparts.